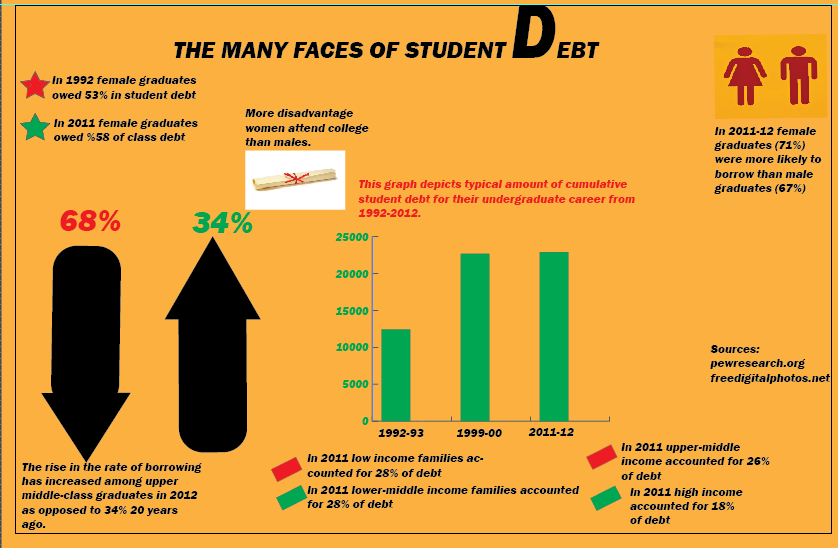
Designing this particular project was anything but easy. Yet, I found myself enjoying the Adobe Illustrator ride. With all of its’ twists and turns, Adobe Illustrator was a great tool to utilize when creating my infographic. The focus of my infographic was student debt and how it has changed demographics throughout the years. I chose to create data visualization to go along with this data headed by Pew Research because of its pertinence. As a first generation female college undergrad, student loans are something I am all too familiar with. It was interesting to see the amount of students, more specifically women and the alarming rates at which they are incurring student debts. I included some facts about men and their student debt, but chose not to delve into it. I wanted to focus in on women and the different income demographics that borrow.
This infographic includes shapes, graphs, images and text. I did not want to overwhelm the page with heavy numbers and graphs, instead I used vibrant colors and shapes to tell a story. I tried to make my infographic as organized as possible. I did not want the reader to be overwhelmed with clutter. I also kept the text consistent, only using Franklin Gothic Heavy typeface. I utilized the touch-type tool to give the header some flare. Any image used was legally obtained from freedigitalphotos.net. I also included a source list, where I got all my information from.
In my opinion, this project pushed me to get outside my comfort zone and create an infographic, which I have never done before. Although it was difficult, I learned how to create graphs within Adobe Illustrator as well as how to create shapes through the use of the shape tools. Overall, this project should convey some very interesting facts, hope you enjoy.